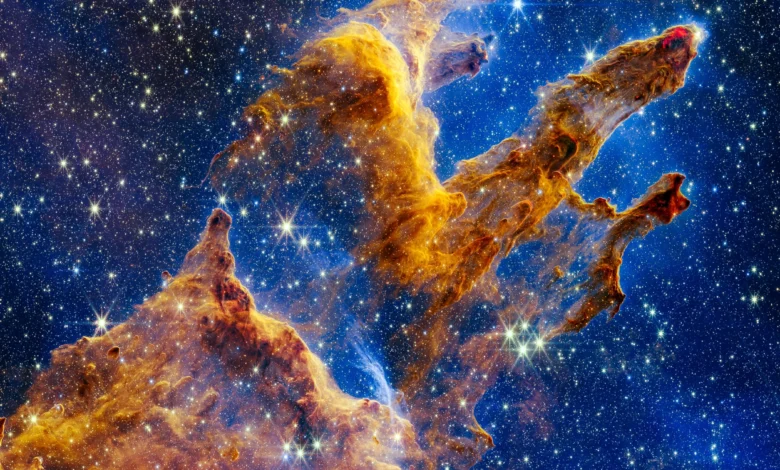
For over half a century, the space stretching between the stars within our galaxy was characterized by astronomers as a largely static backdrop—a quiet, predictable canvas across which the flashier, more energetic dramas of the universe played out. This vast expanse, known as the interstellar medium (ISM), was long thought to consist of a diffuse, nearly imperceptible fog of hydrogen, helium, and cosmic dust existing in a state of calm, tranquil equilibrium. However, a wave of advanced three-dimensional cartography is shattering this long-standing paradigm. Recent high-resolution mapping efforts are bringing the true, dynamic nature of the interstellar medium into sharp focus, revealing that much of the cosmic void is not tranquil at all, but rather intensely unstable, churning, and perpetually in flux.
This unexpected revelation directly contradicts the foundational theoretical models that have populated astrophysics textbooks for generations. More importantly, this seismic shift in perspective may finally provide a missing piece to a stubborn astronomical puzzle: why galaxies are so remarkably inefficient at converting their vast reservoirs of raw gas and dust into stars.
Unpacking the Cosmic Void: The Interstellar Medium
To the casual observer, outer space appears to be a total vacuum. Yet, even the deepest voids contain a faint, persistent mist of atoms and molecules. In 2020, NASA’s New Horizons spacecraft—having successfully journeyed far beyond the orbit of Pluto—measured a proxy for the density of hydrogen surrounding it. Navigating the dark expanses between stars, the probe detected approximately 130 hydrogen atoms per liter of space.
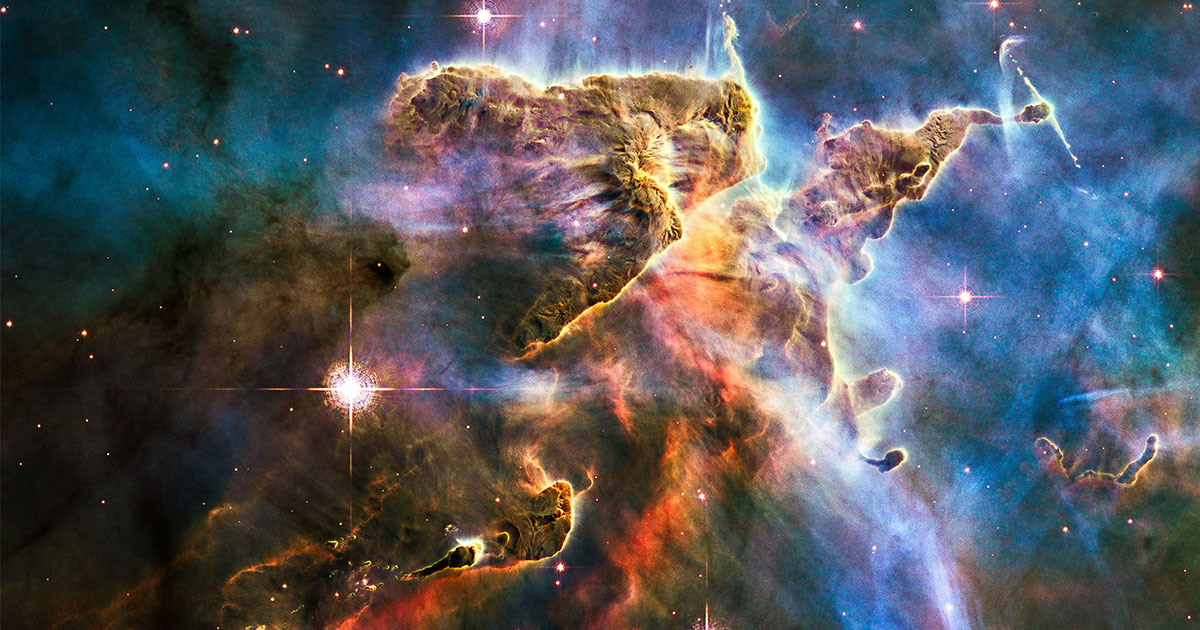
This primordial hydrogen, along with traces of helium and heavier molecules, is a leftover relic of the Big Bang. Crucially, it is not isolated; it is continuously replenished and stirred by cosmic phenomena. As stars are born, they eject powerful jets of gas and dust; as they age and die, they shed their outer envelopes and detonate in violent supernovae, injecting immense amounts of energy, heat, and material back into the galactic ecosystem.
Despite this continuous injection of energy, mid-20th-century astrophysical models assumed that the ISM quickly settled into predictable thermal states. In 1969, pioneering researchers George Field, Donald Goldsmith, and Harm Habing formulated what became the standard model for ISM behavior. They predicted that interstellar gas and dust would naturally segregate into two stable thermodynamic phases: cold and warm.
According to the Field-Goldsmith-Habing model, as dispersed gas and dust drift through space, gravity pulls them into cohesive clouds. Within these regions, fast-moving molecules collide and dissipate energy, causing temperatures to plummet to a frigid 100 kelvins (roughly minus 173 degrees Celsius). Conversely, gas exposed to intense ultraviolet radiation from nearby stars is prevented from collapsing, maintaining a steady, diffuse state at approximately 8,000 kelvins.
In 1977, astrophysicists Chris McKee and Jeremiah Ostriker expanded this framework by introducing a blistering third phase: shock fronts generated by supernova explosions could superheat surrounding gas into a scorching plasma reaching temperatures of half a million kelvins. Despite this added complexity, the prevailing theoretical consensus maintained that atomic gas residing outside these violent blast zones achieved a calm, pressure-balanced equilibrium, leaving practically no unstable, intermediate material behind.
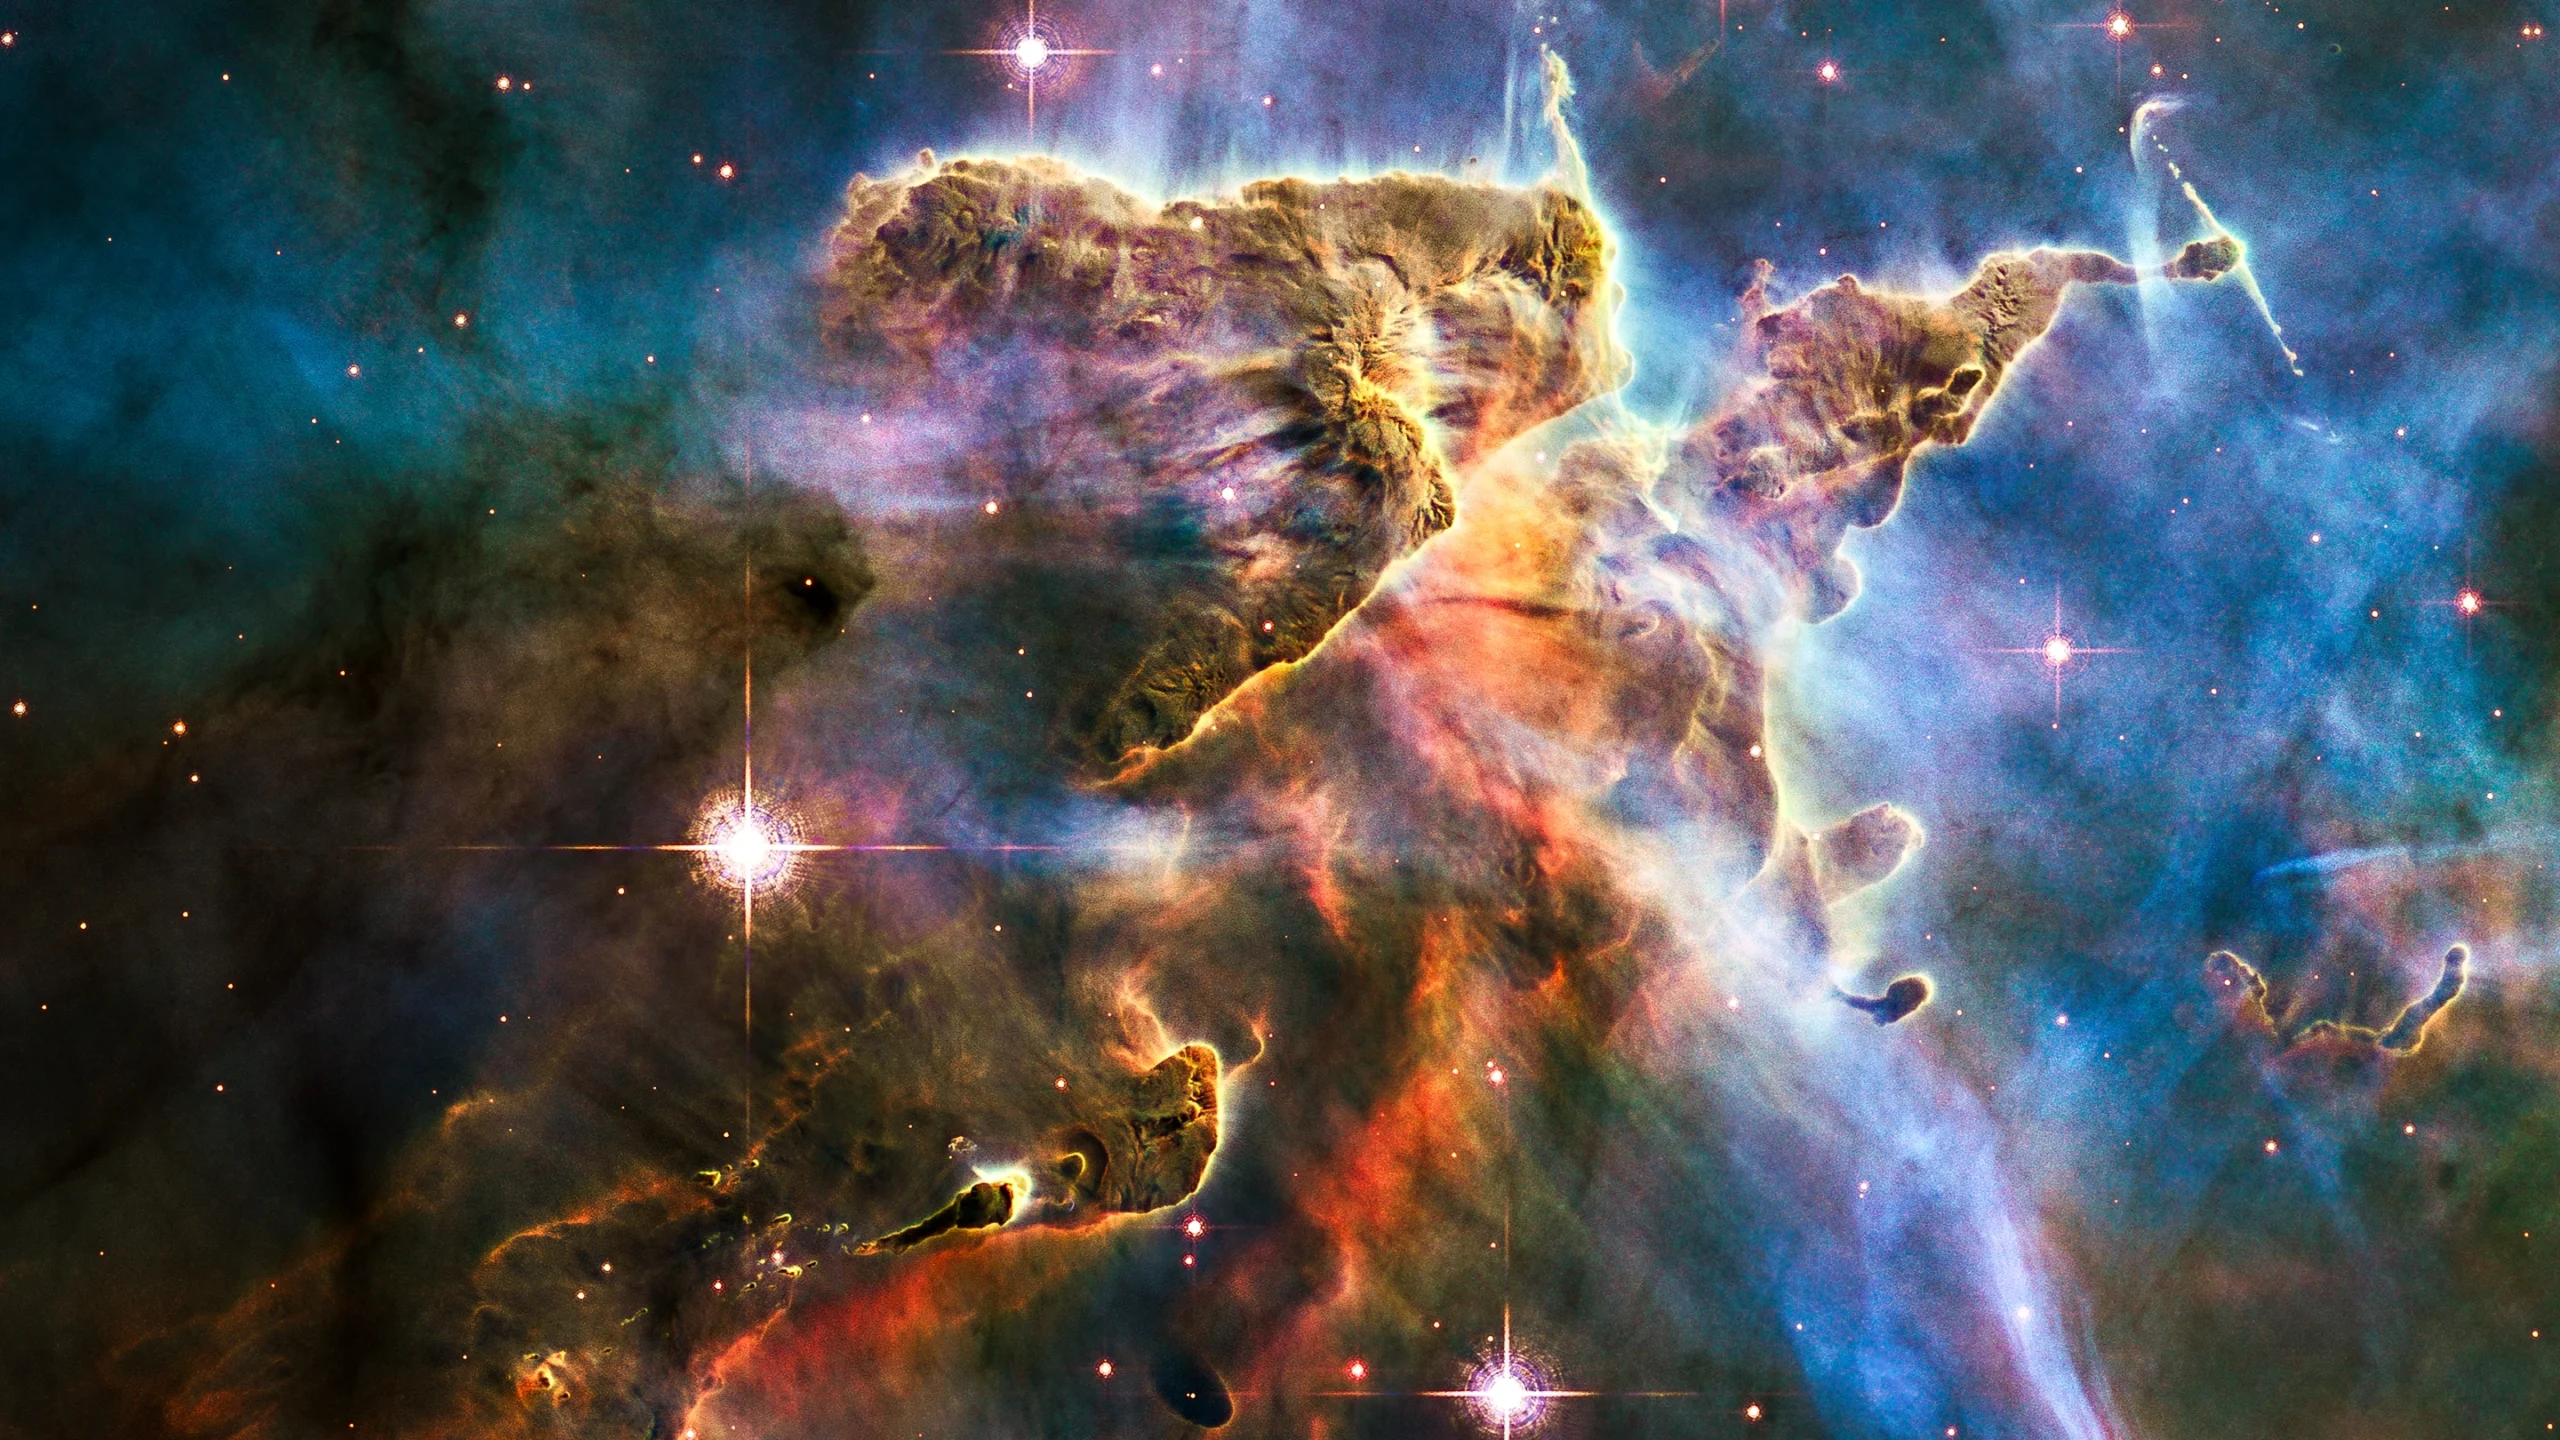
The Observational Bottleneck: A Half-Century Blind Spot
Testing these theoretical models has historically presented monumental technical challenges. Cold atomic hydrogen, for instance, emits no visible light, rendering it invisible to standard optical telescopes. To measure it, astronomers must search for a rare atomic phenomenon: the spontaneous flipping of the relative spins of a hydrogen atom’s proton and electron. This subtle quantum transition emits a faint radio wave at a specific wavelength of 21 centimeters.
For more than seventy years, astronomers pointed massive radio dishes toward the heavens to capture these faint whispers of cosmic gas. However, looking outward along a single line of sight from Earth yields a hopelessly tangled composite of signals originating from countless overlapping clouds. Trying to parse this data was functionally equivalent to peering through a stack of semitransparent, multicolored plastic sheets; the colors blend together, making it virtually impossible to isolate any individual layer.
As a result, the fine details of the interstellar medium were largely ignored or generalized, relegated to the background while researchers focused on stars, galaxies, and black holes. It was only with the advent of space-based astrometry and sophisticated statistical modeling in the 21st century that astronomers finally acquired the tools to pull these cosmic layers apart.
The Gaia Breakthrough and the Rise of 3D Cartography
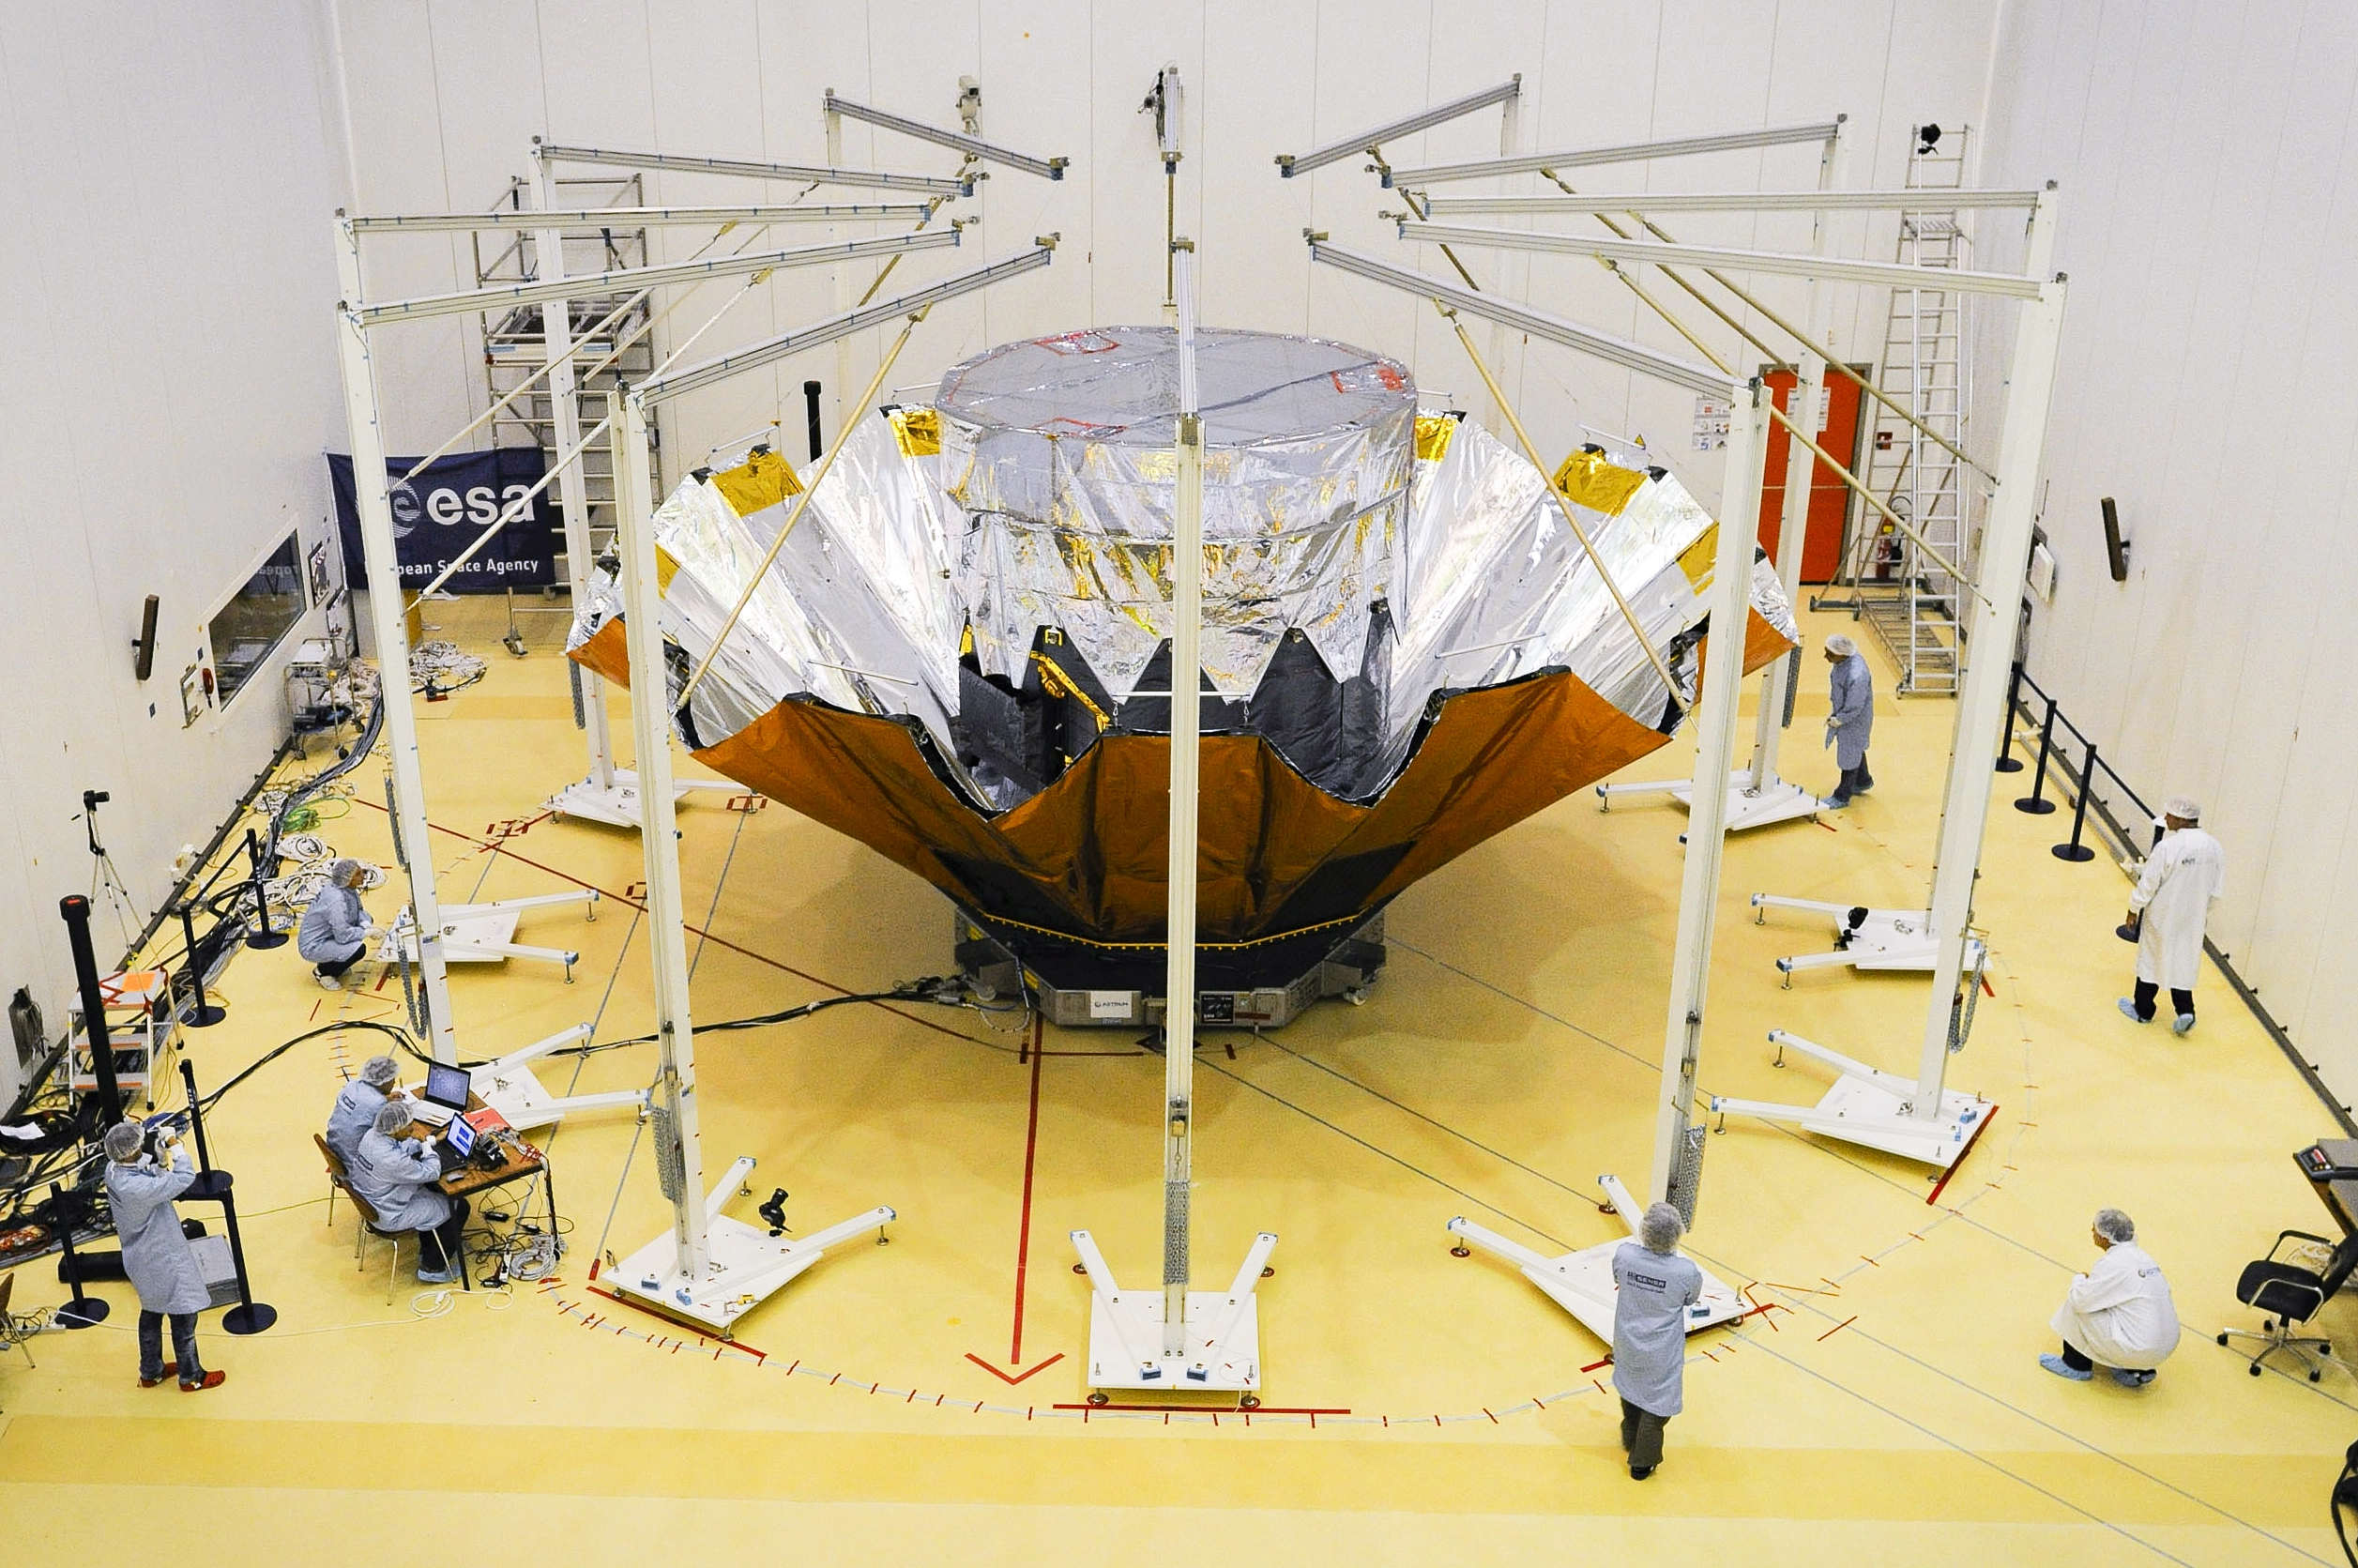
The true turning point arrived courtesy of the European Space Agency’s Gaia telescope. Launched in 2013, Gaia was designed to map the Milky Way with unprecedented precision by measuring the positions, distances, and motions of nearly two billion stars.
Gaia achieved this through parallax—the same perceptual shift one experiences when holding a thumb at arm’s length and alternatingly closing each eye, observing how the thumb appears to move relative to the background. By observing stars from varying vantage points as Earth completed its annual orbit around the sun, Gaia accurately pinned down their exact distances from Earth.
Armed with accurate stellar distances, astrophysicists could then analyze how starlight dimmed and reddened—a process known as interstellar extinction—as it traveled through the intervening dust of the ISM. By aggregating this photometric data from multiple angles, researchers gained the raw ingredients necessary to reconstruct the spatial distribution of galactic dust.
Yet, transforming this wealth of data into a coherent three-dimensional map was an immense computational hurdle. Gregory Green, an astronomer at Westlake University in Hangzhou, China, notes that numerous theoretical configurations of the ISM could technically satisfy the same observational dataset. While accumulating more data placed tighter constraints on the models, it exponentially complicated the underlying calculations. The challenge lay in extracting the most physically plausible arrangement from math that quickly became overwhelmingly complex.
Over the past decade, Green and international teams of researchers developed sophisticated statistical frameworks to conquer this computational barrier. In 2024, an independent group leveraged these tools to publish a groundbreaking, continuous three-dimensional map detailing the density of interstellar dust across a spherical volume spanning more than 4,000 light-years around our solar system.
While this map brilliantly illuminated the geography of dense dust clouds, it lacked thermal data—it could not indicate whether the dust was hot or cold. Completing the picture required a secondary map detailing the distribution of the ultraviolet radiation driving interstellar heating.
An Accidental Partnership and a Stunning Discovery
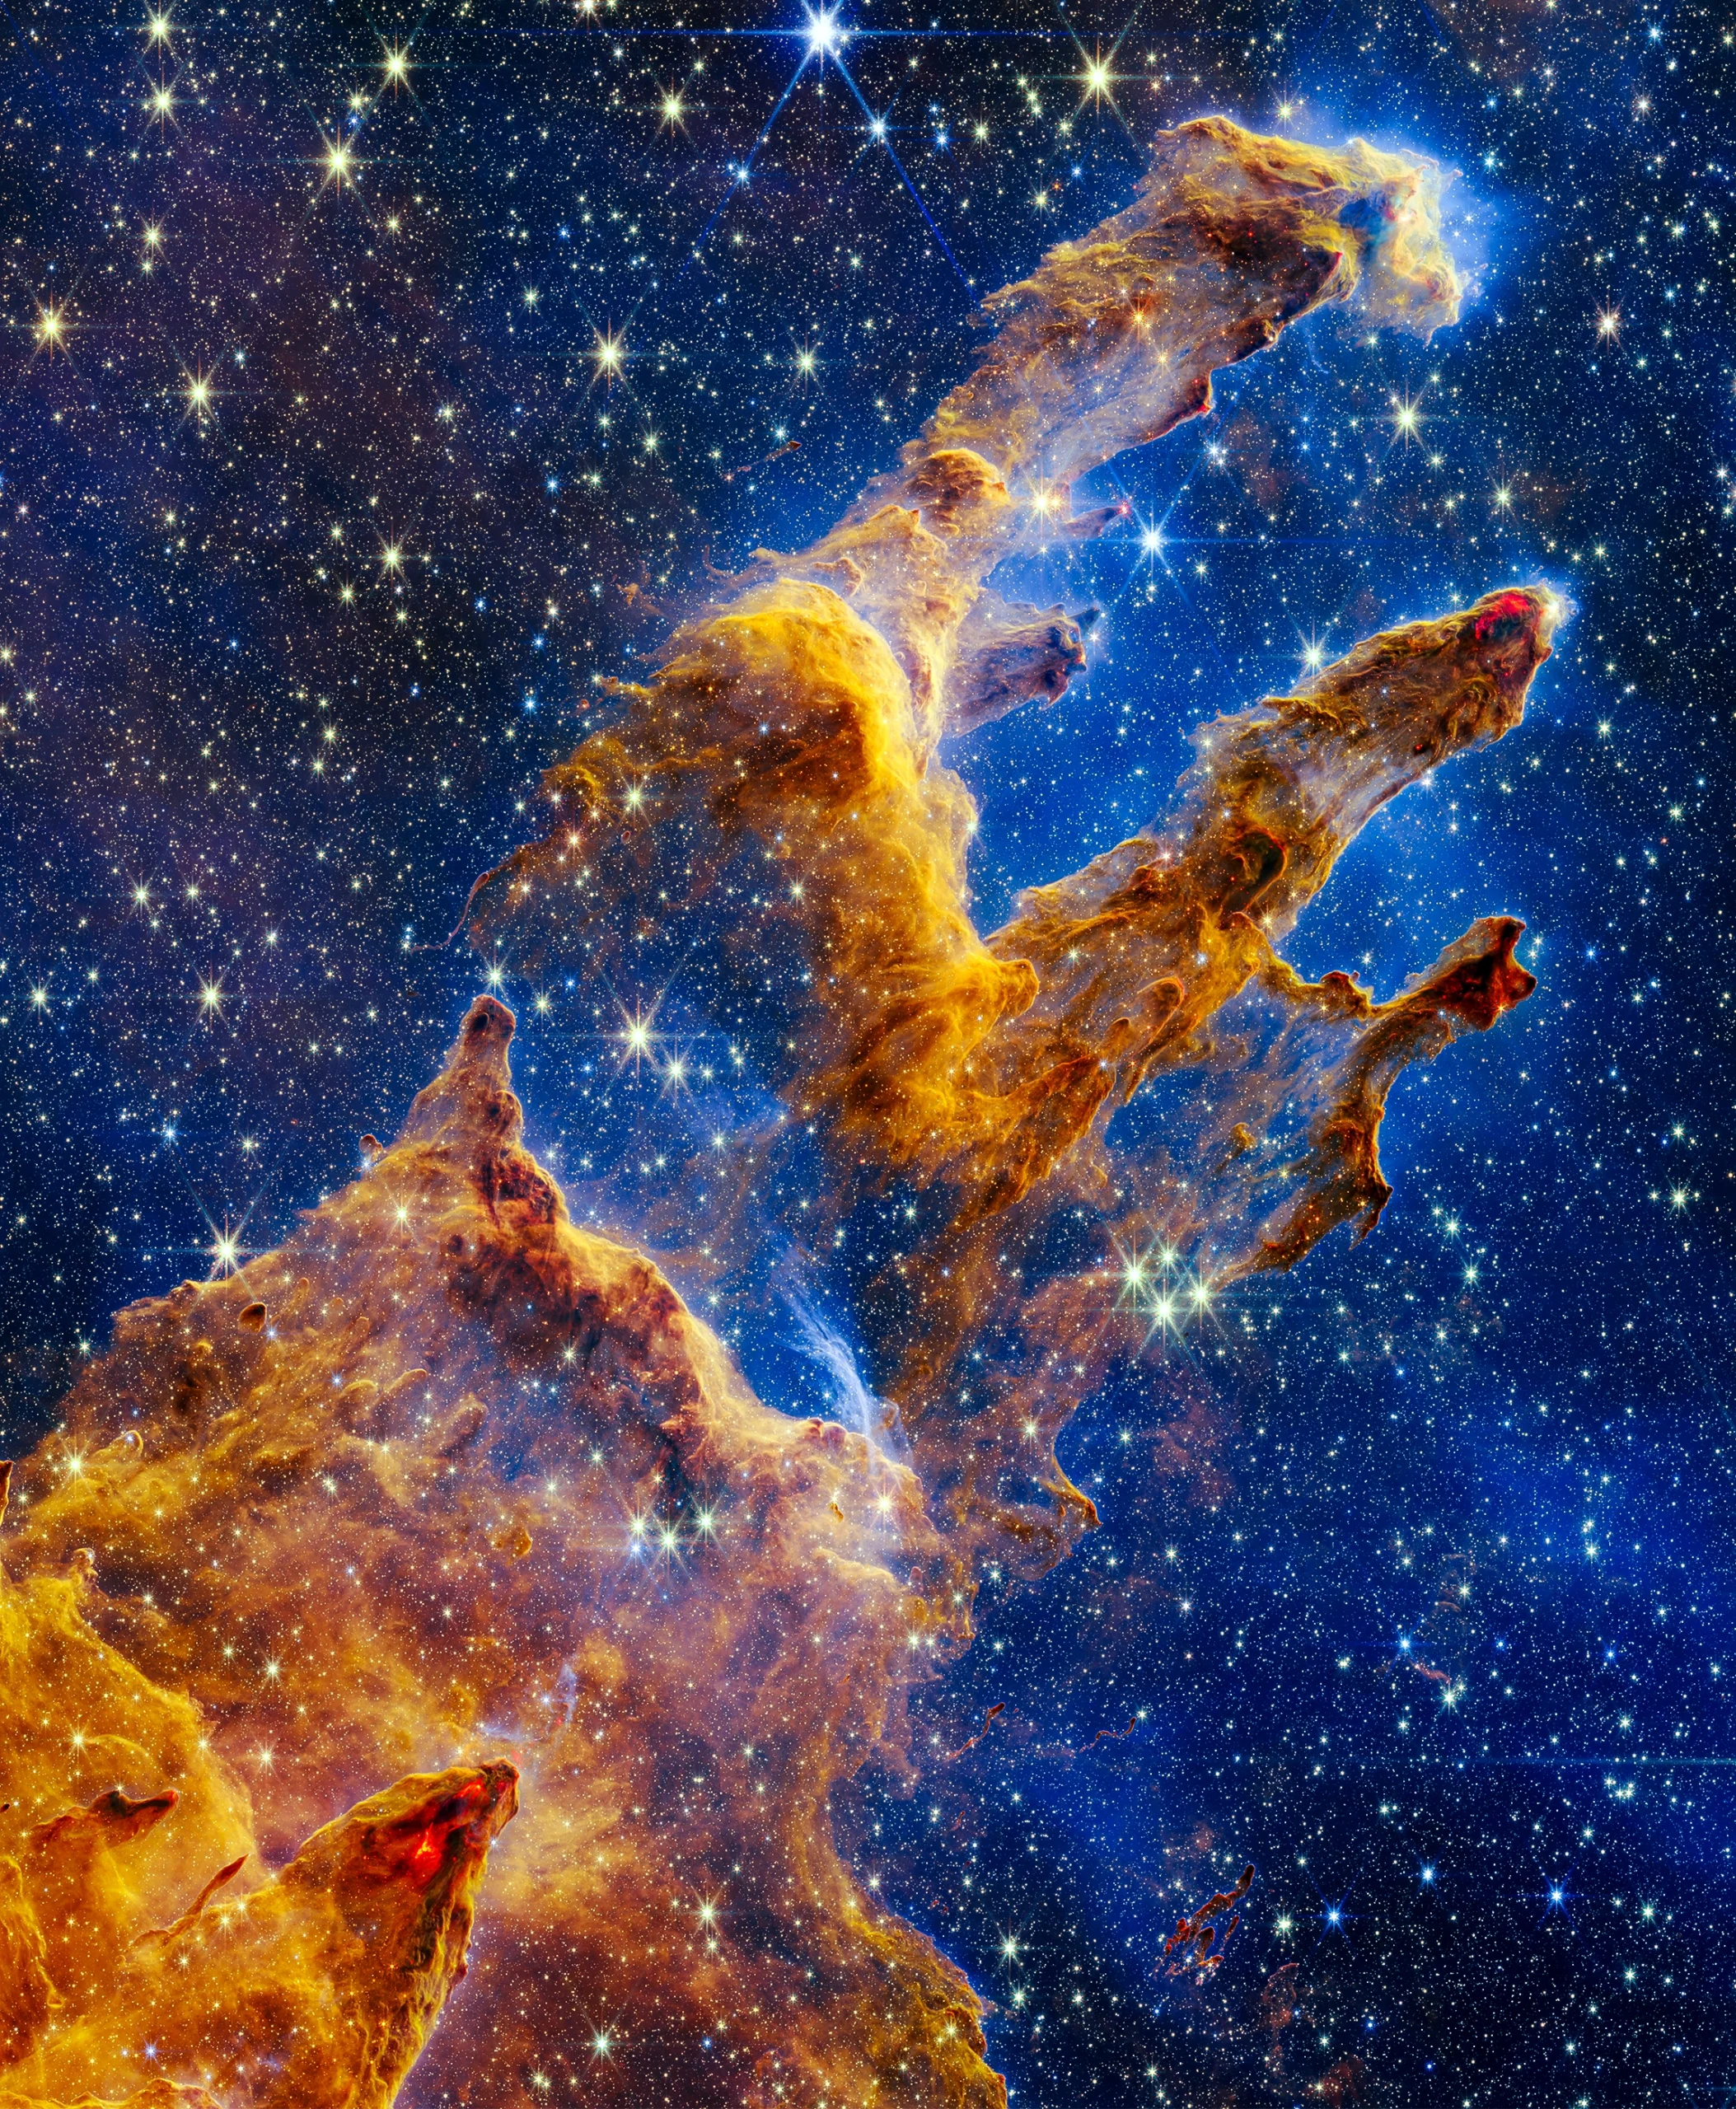
The missing thermal puzzle piece fell into place through academic serendipity. In 2024, Jonathan Shelest, an undergraduate student at the Technion in Haifa, Israel, attended an astrophysics seminar where Professor Shmuel Bialy projected stunning imagery of billowing gas and dust structures like the Pillars of Creation. Inspired by the geometry and dynamics of the interstellar medium, Shelest approached Bialy after class to request a research position.
Coincidentally, Bialy had been searching for a student willing to tackle the problem of three-dimensional ISM mapping. Shortly thereafter, Bialy attended an academic conference where he struck up a conversation with Stanford University astrophysicist Troy Porter, who had quietly compiled a detailed, unpublished map of galactic ultraviolet radiation fields.
Pooling their resources, Shelest, Bialy, and their collaborators set out to fuse Gaia’s dust density data with Porter’s radiation mapping—a massive computational undertaking involving over 200 gigabytes of data. For every coordinate in their three-dimensional grid, the team cross-referenced dust density against radiation intensity to determine local temperatures.
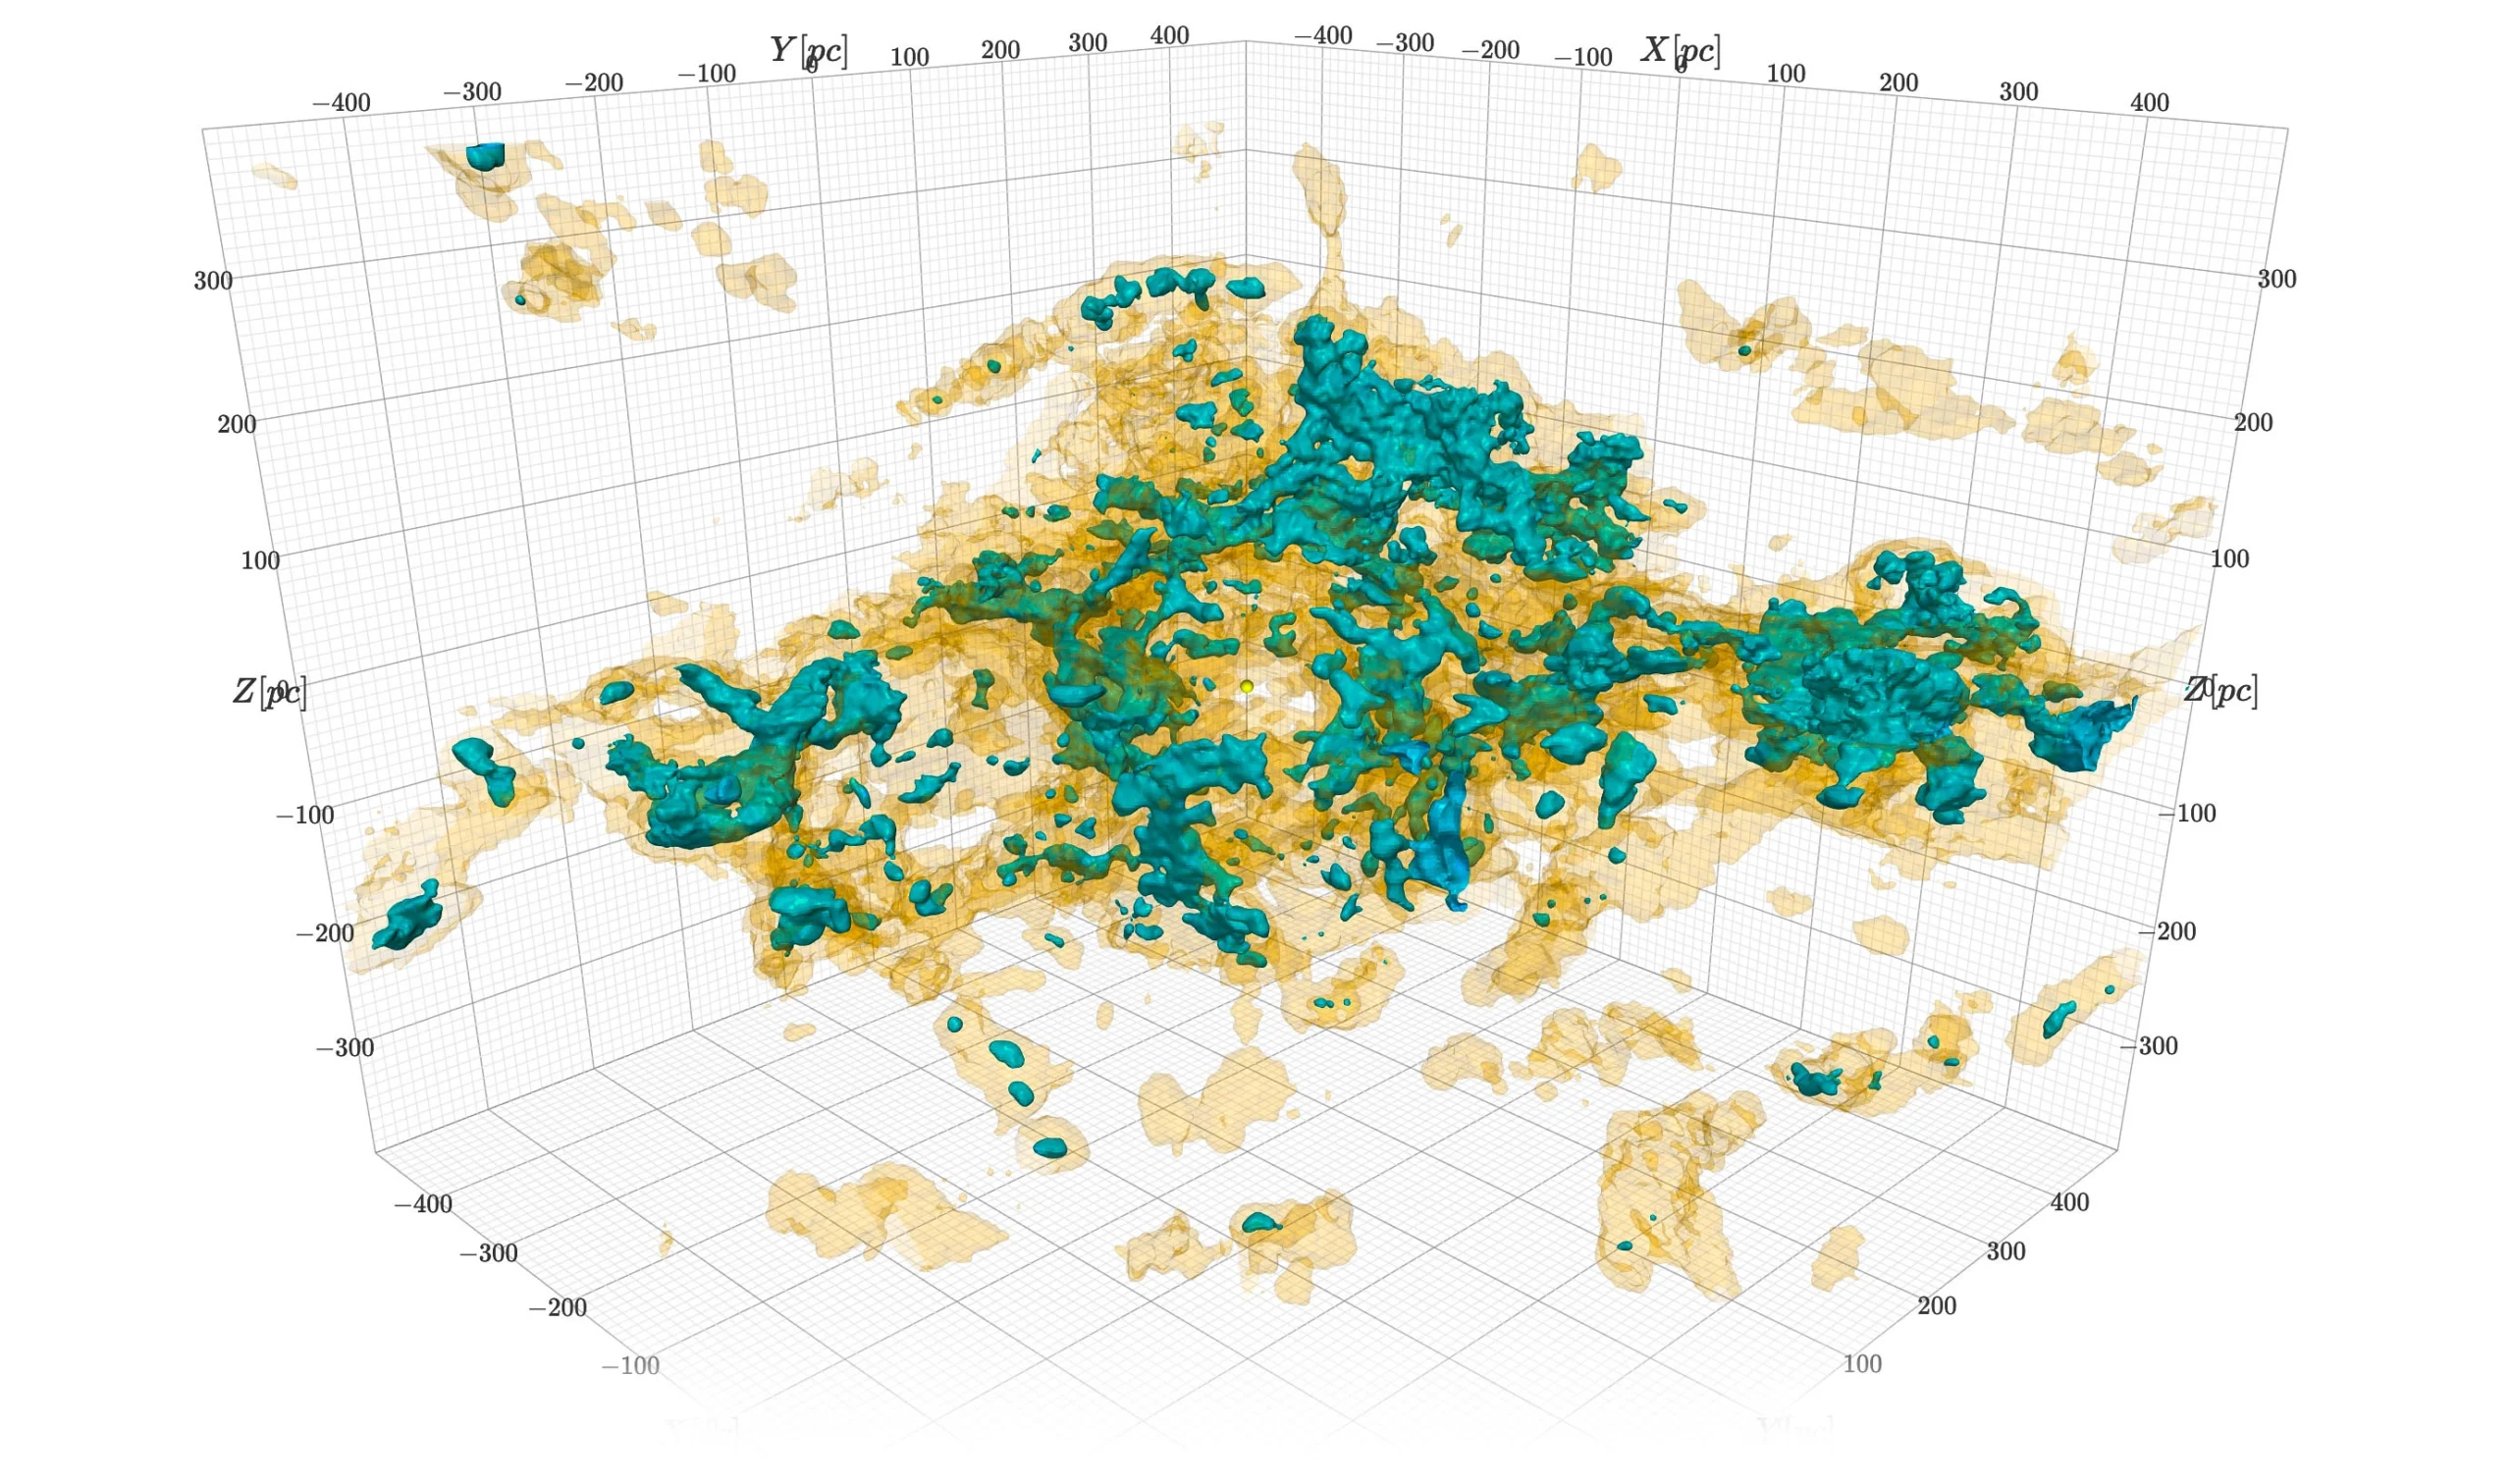
When Shelest ran the final analysis on the overall temperature distribution of the ISM in our galactic neighborhood, the results stunned the research team. Far from conforming to the traditional expectation of distinct warm and cold states, the data revealed that 27% of the ISM was cold, 32% was warm, and a staggering 41% sat squarely in the forbidden zone—occupying an unstable, intermediate thermal state.
"I thought I was wrong," Shelest recalled. "How do you go to your science adviser and tell him that you get so much unstable media?"
Upon rigorous inspection, however, the anomalies were not artifacts of random statistical noise or algorithmic errors. Instead, the unstable medium formed massive, coherent blankets entirely wrapping around the denser, cold gas clouds.
Scientific Scrutiny and Theoretical Implications
In July 2026, the research team published their findings on the arXiv preprint repository, immediately sparking intense excitement, debate, and collaboration requests from across the global astronomical community.
Despite the enthusiasm, leading astrophysicists have urged caution before rewriting the astrophysics curriculum. Chris McKee noted that the model could potentially overestimate the volume of unstable ISM if distinct cold and warm pockets reside too close together for the current resolution of the maps to separate. Similarly, Philipp Frank of the Kavli Institute for Particle Astrophysics and Cosmology at Stanford suggested that the team’s use of an "ensemble-averaged mean"—a mathematical smoothing technique—might artificially soften sharp thermal boundaries into gradual slopes, thereby inflating the calculated volume of intermediate gas.
Shelest and Bialy acknowledge these technical limitations, pointing out that their manuscript is undergoing rigorous peer review. However, they maintain that mathematical smoothing alone cannot account for the sheer scale of the unstable medium. When the authors tested their methodology against an entirely independent dust map featuring lower resolution, the calculated unstable fraction shifted by a mere five percent.
Independent researchers find the implications of the map profound. Adam Ginsburg, an astronomer at the University of Florida, notes that the presence of such vast quantities of midrange medium suggests current static theories are fundamentally incomplete. "Something is taking material that should, by the static theory, be sitting in one of these other two states, and it’s stirring it up so that it’s being forced to change states," Ginsburg explained.
Desika Narayanan, also of the University of Florida, offered an organic analogy: "Just like your blood in your body is going to have metabolic waste or oxygen in it, and it’s moving different things to different places, the ISM is doing the same thing, but with energy, and it’s constantly in a state of flux."

Solving the Star Formation Puzzle
Beyond reshaping our understanding of interstellar thermodynamics, these findings offer a long-sought solution to a major astrophysical mystery: why galaxies are so inefficient at star formation.
Theoretical simulations have long struggled to explain why vast quantities of gas and dust do not immediately collapse into stars. The new 3D mapping implies that stellar birth is actively regulated and suppressed by the continuous cycle of heating and cooling that violently churns the ISM.
"The reason why star formation is very inefficient is that feedback heats up and pushes on the surrounding gas," said Anna Rosen, an astrophysicist at San Diego State University. According to Rosen, traditional models provide accurate "physically grounded snapshots" of isolated hot and cold patches, but they fail to capture the dynamic, chaotic reality occurring between those frozen frames.
As astronomers continue to refine their models and peel back the layers of our galaxy’s invisible scaffolding, the interstellar medium is finally stepping out from the shadows of theory. No longer viewed as a passive, empty backdrop, the space between the stars is emerging as the beating heart of galactic evolution—a turbulent, living circulatory system driven by energy, instability, and eternal change.
Related posts: